Big Data Analysis
with Hadoop
Processing millions of accident records using parallel MapReduce chains on a Dockerized cluster infrastructure.
The Problem
Dataset processing for millions of records becomes slow and resource-heavy on a single machine. Traditional serial processing cannot handle the volume, and fault tolerance is non-existent if a single node fails.
We need a way to transform raw accident coordinates into geographical "Hotspots" efficiently. Our goal is to calculate a Hotspot Score based on accident severity across a global grid system.
> System ready for MapReduce job submission...
> Docker cluster status: HEALTHY (5 Containers UP)
Our Distributed Solution
We architected a Docker-based Hadoop Cluster consisting of a Master (Namenode/ResourceManager) and multiple Workers (Datanode/NodeManager). The implementation uses the Python Hadoop Streaming API to execute distributed logic.
1. Map Phase (`mapper.py`)
Each worker node reads a chunk of the CSV. It "snaps" individual accident coordinates to a 1.1km x 1.1km grid and assigns severity weights (Fatal: 3, Serious: 2, Slight: 1).
2. Shuffle & Sort
Hadoop automatically redistributes the mapped keys (Grid IDs) so that all data points for the same grid land on the same reducer node.
3. Reduce Phase (`reducer.py`)
The reducers sum up the severity weights for each unique Grid ID to produce the final Hotspot Density Score.
Mapper Logic
# Map to 2-decimal grid
grid_id = f"{round(lat,2)},{round(lon,2)}"
weight = 3 if sev == 'Fatal' else 1
print(f"{grid_id}\t{weight}")
Reducer Logic
# Aggregate by Grid ID
total_weight += int(weight)
# ... after grouping ...
print(f"{current_grid}\t{total_weight}")
Analysis Results
The final output represents identified high-risk zones. Areas with a higher score indicate regions that are not only accident-prone but specifically prone to fatal incidents.
Hotspot Density Distribution
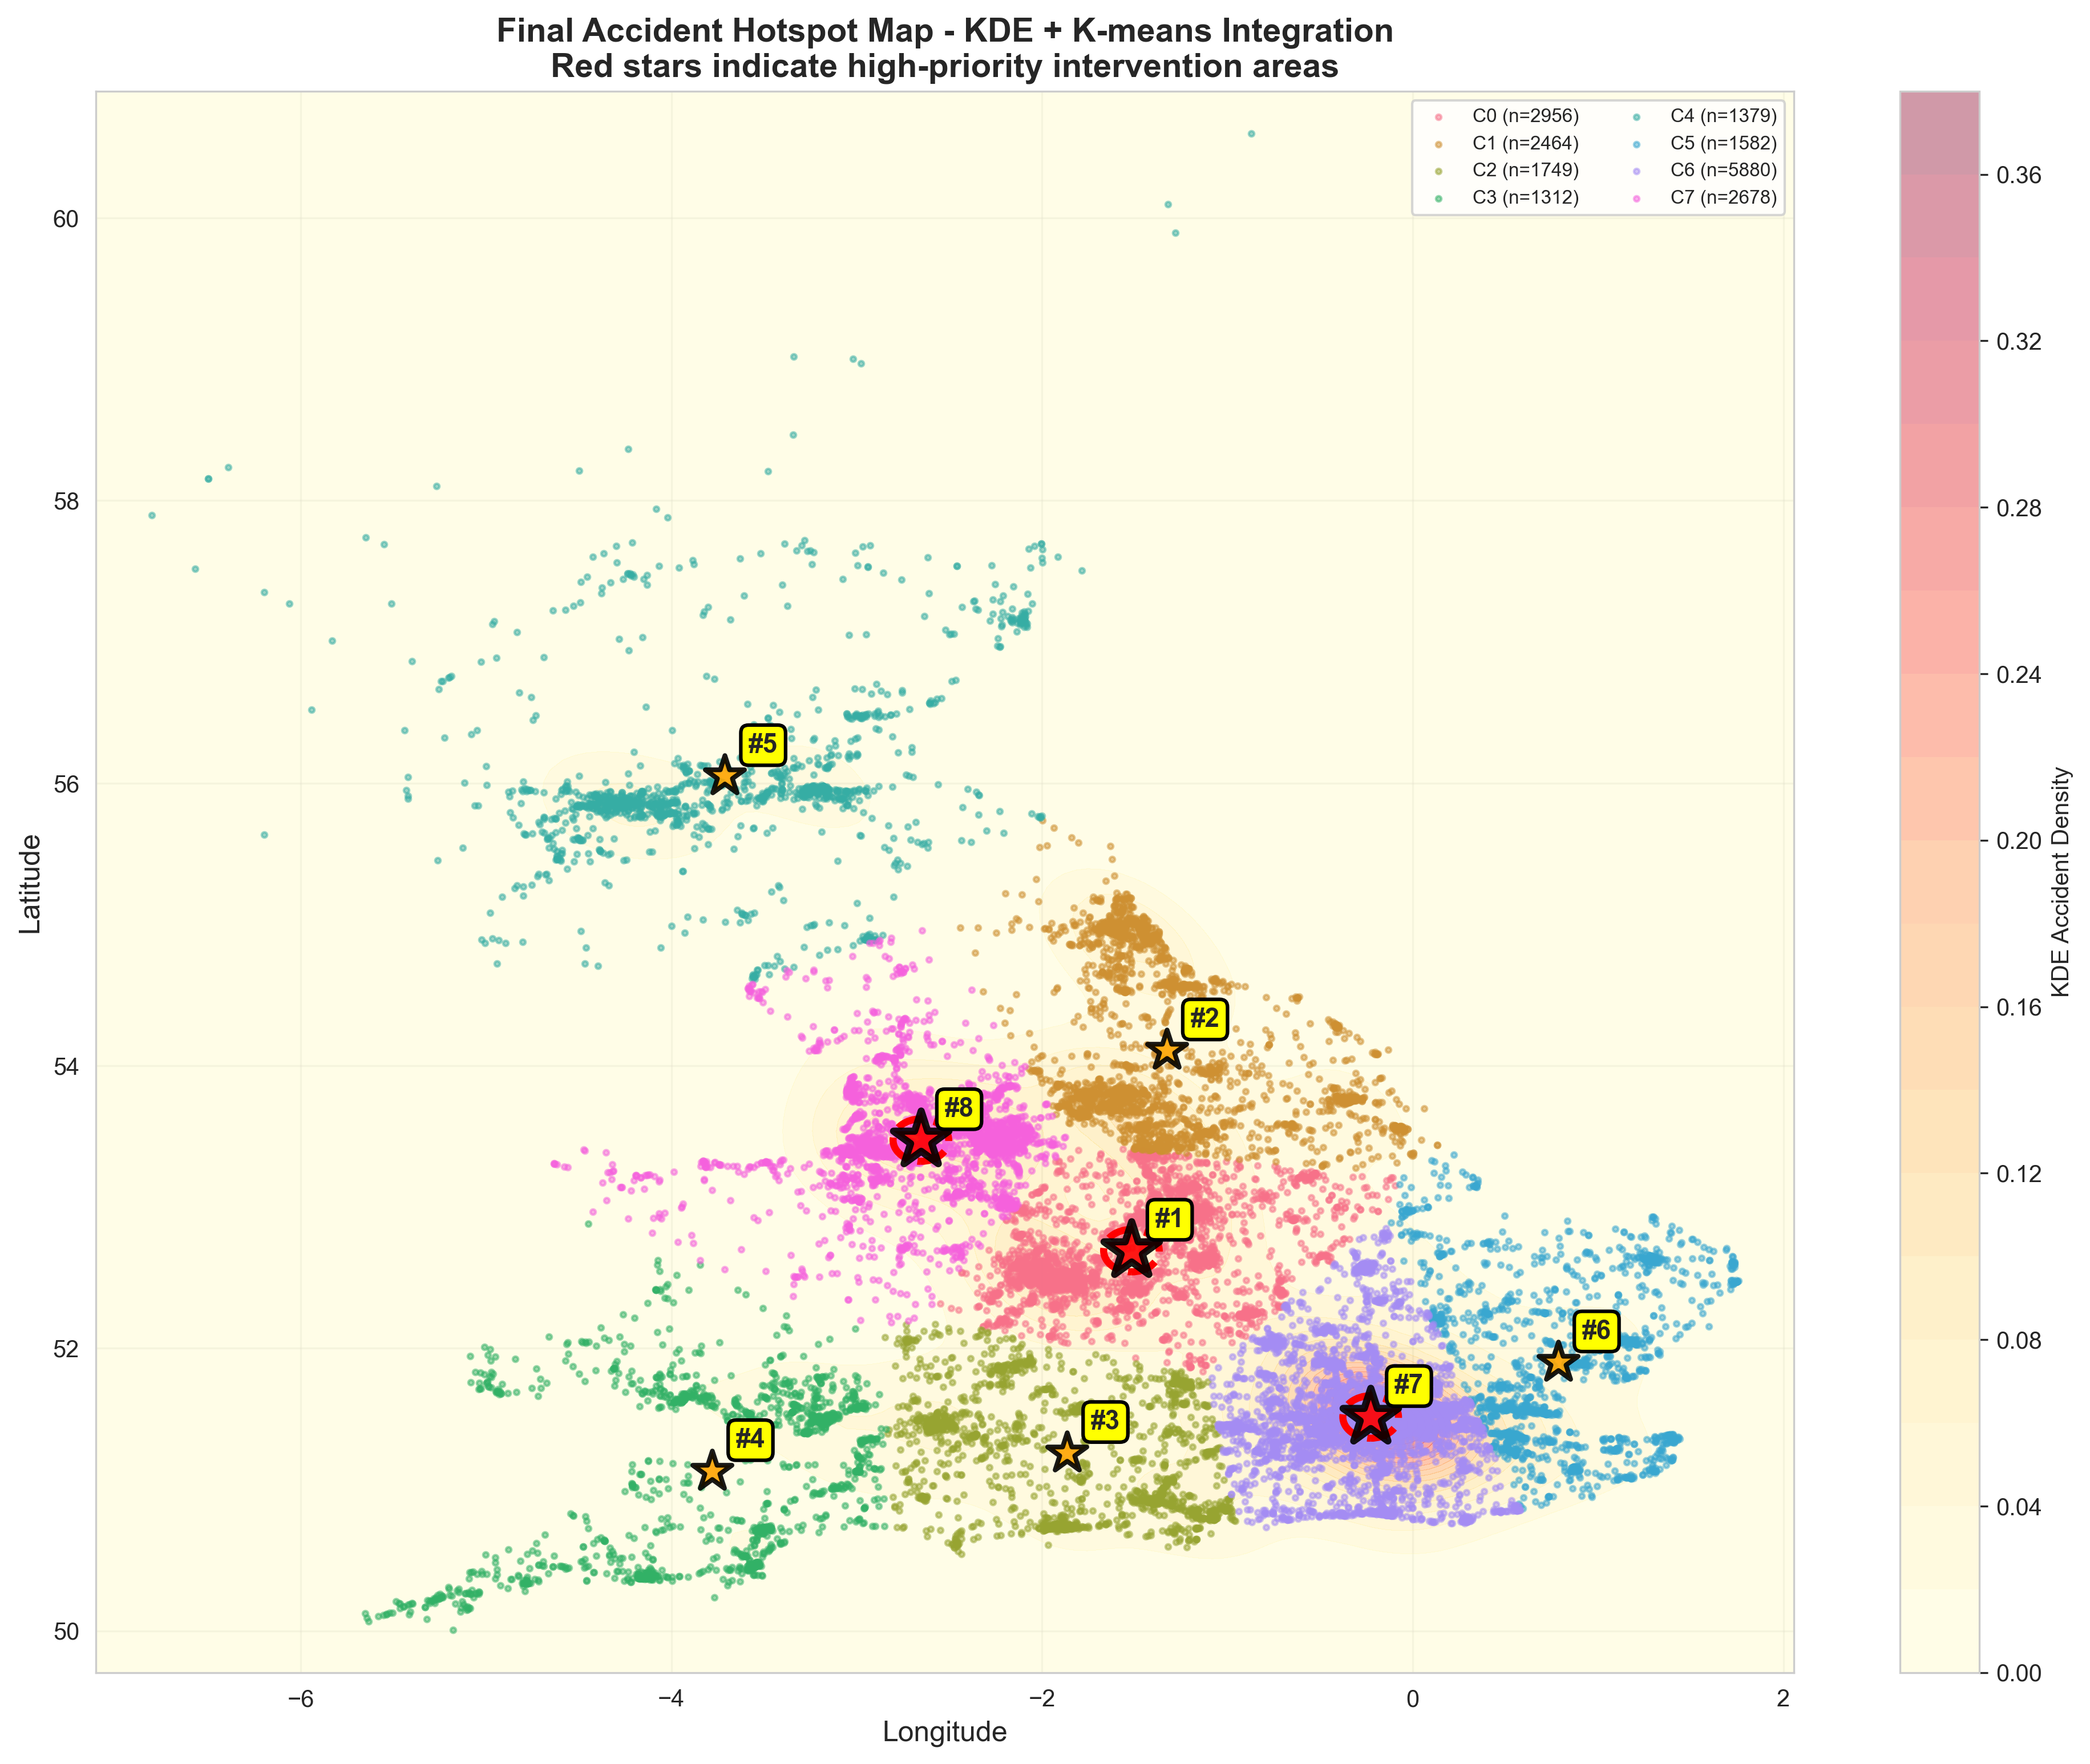
Visualized using the aggregate scores generated from the Hadoop pipeline.